Figures provided in all three categories are subject to the terms of CC BY-ND 4.0. In essence you may use, without modifications, provided you reference SCFCan and this website.
Phase Diagrams - Carbon Dioxide
Phase Diagrams (P-T, P-h, P-v, T-𝜌, T-s) are provided for Carbon Dioxide. You may open each figure in a new tab (browser dependent) or download a high resolution TIFF file.
An annotated thermodynamic cycle is shown here on the P-h phase diagram as an example.
Pressure - Enthalpy
Thermodynamic Cycle
P-h
Pressure Range:
0 to 40 MPa
Enthalpy Range:
-400 to 50 kJ/kg
Solubility Graphs - Carbon Dioxide
A binary system and a ternary system are provided as examples
Naphthalene
Solubility in
CO2
Solubility Range:
0 to 0.14 mol/mol
Pressure Range:
0 to 30 MPa
Temperature Range:
300 to 360 K
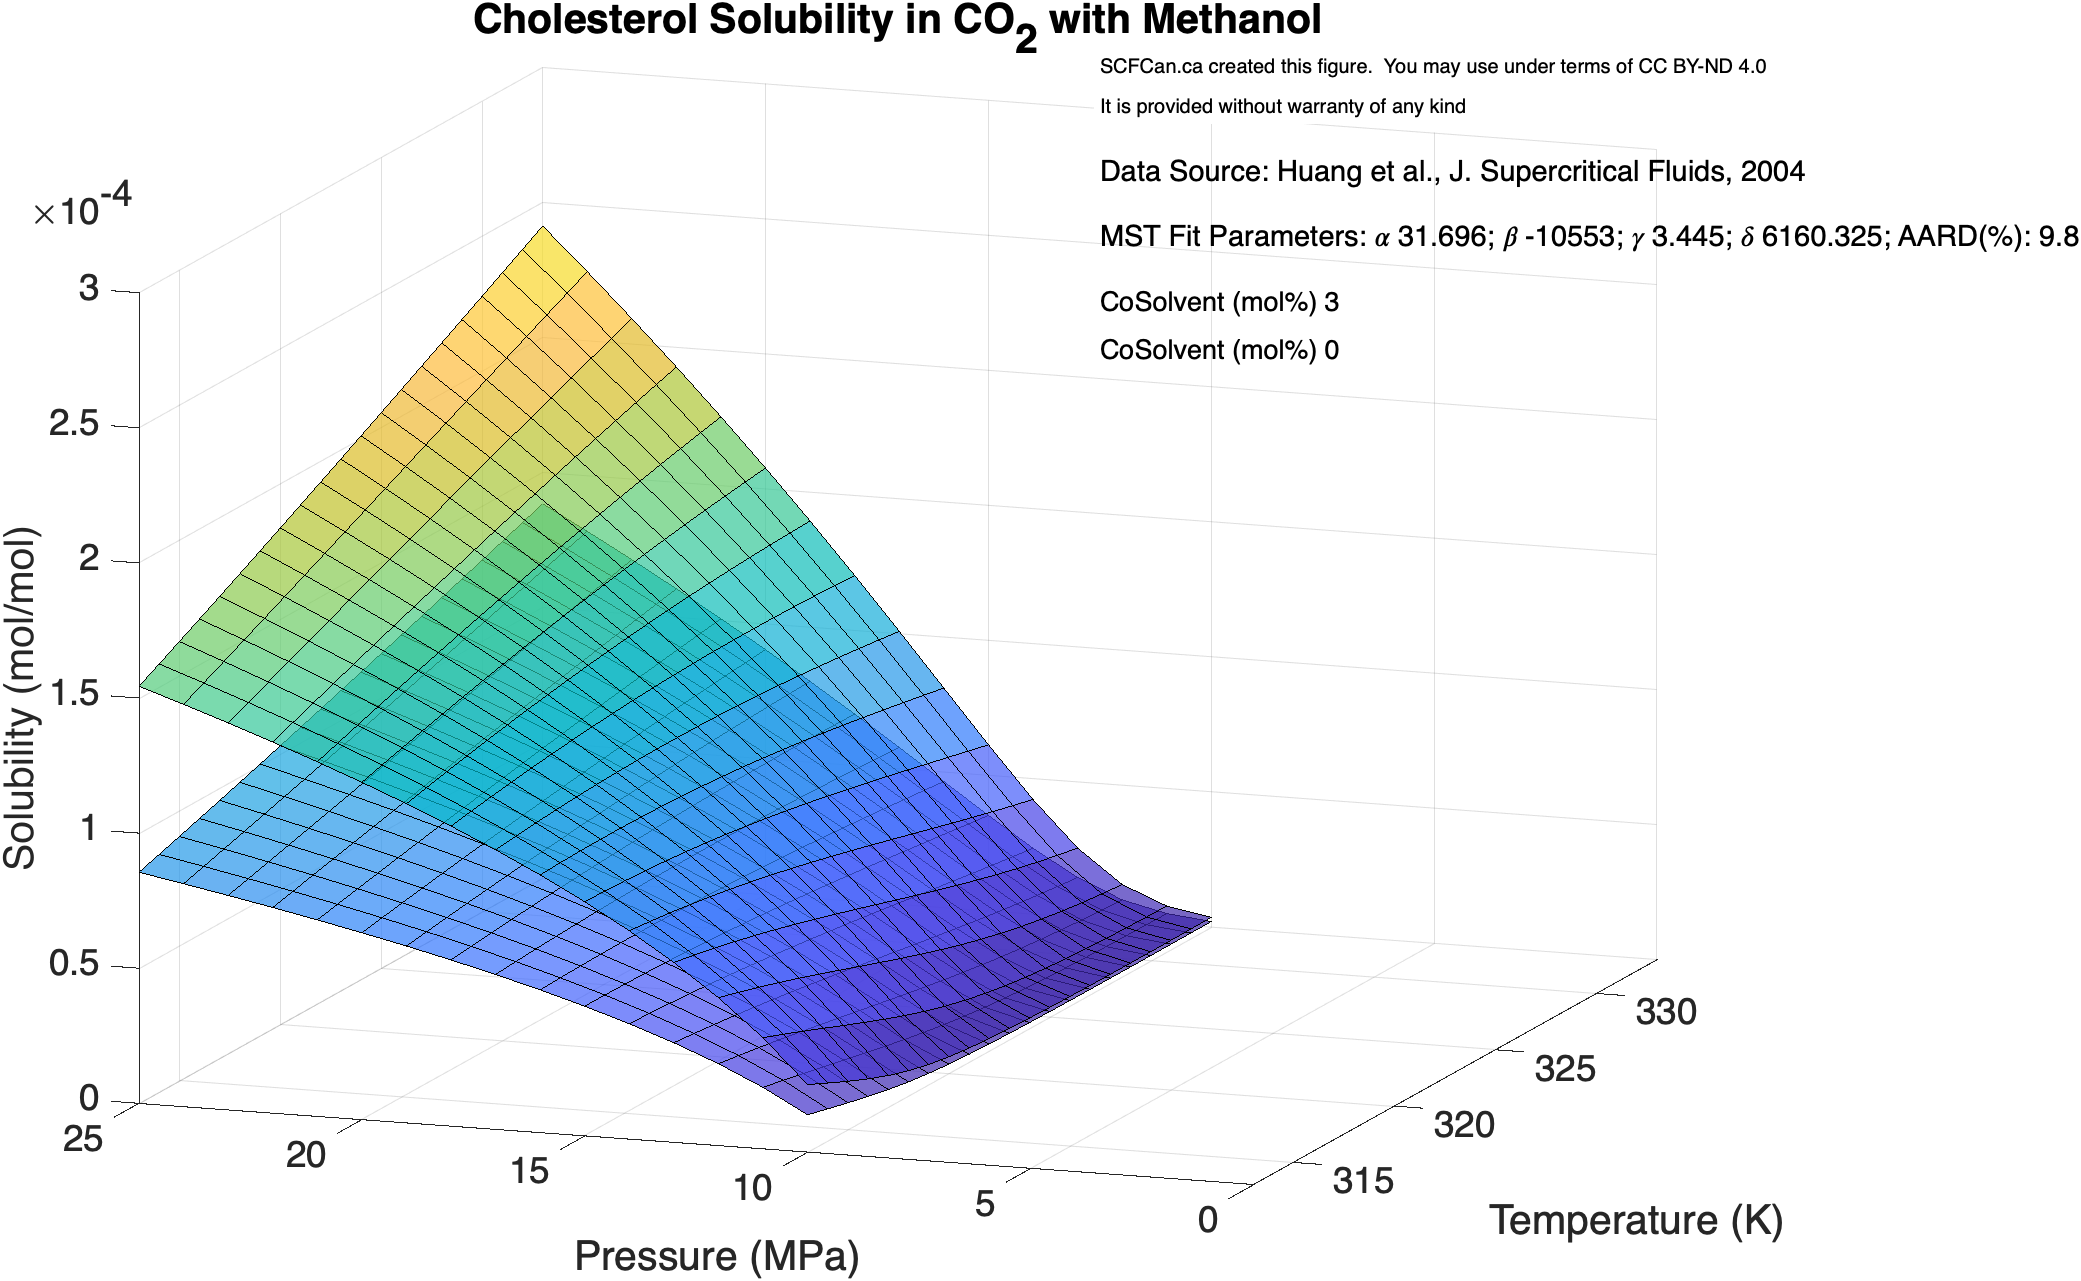
Cholesterol
Solubility in
CO2
with Methanol
Solubility Range:
0 to 0.0003 mol/mol
Pressure Range:
0 to 25 MPa
Temperature Range:
310 to 335 K
FAQ
1
What is the source of data used to create these figures?
Span & Wagner’s Fundamental Equation of State (FEOS) has been used for all figures (Span, R.; Wagner, W. 1996. A new equation of state for carbon dioxide covering the fluid region from the triple-point temperature to 1100 K at pressures up to 800 MPa. Journal of Physical and Chemical Reference Data, 25: 1509–1596).
Solubility graphs rely on measured solubility data that has been fitted by Chrastil's model (binary systems) and Mendez-Santiago Teja's model (ternary systems with cosolvents).
2
How can I get customized figures?
Customized figures are available upon request. A small number of different fonts, colours etc. can be readily provided. More significant modifications are possible – ask and we will see what we can do for you. Some custom options may be freely provided whereas others may require a negotiated fee. Contact us through the form below.
3
How should I reference a downloaded figure?
Under CC BY-ND 4.0, you are required to provide attribution to SCFCan in relation to any of your uses. You do not have copyright and you may not transfer copyright. Appropriate attribution is:
SCFCan Website, Thermodynamic Graphs page, accessed Year Month Day at: http://scfcan.ca